
August 26, 2026
By Braden Eberhard
Four teams are left standing. New York Empire, 12-2 out of the East, and Oakland Spiders, 12-1 out of the West, meet in one semifinal, while Austin Sol and Minnesota Wind Chill, both 12-1 and both fresh off winning their own divisions, meet in the other. Three regular-season division champions and a strong East runner-up set to square up in the final games of the 2026 UFA season.
A quick glossary. OE and DE are offensive and defensive efficiency, how often an O-line scores or a D-line gets a stop. OEOE and DEOE (OE/DE vs average team expectancy) take that a step further, comparing what a line actually did against what an average line would be expected to do given the exact same possessions, so a positive number means a unit is outperforming expectations rather than dominating against easy matchups.
Meet The Model
Everything in this piece comes out of a prediction model built for this project over the past several months. Taking a unique approach of modeling overall team strength on a point by point basis, we’re training on the things that drive the result: offense/defense line strength, individual player influence, division difficulty, etc.
One of the best ways to understand a model is to see how it works in practice. Here’s how it’s performed on real 2026 games so far this season, predicting every single one using only what it knew before the game was played.
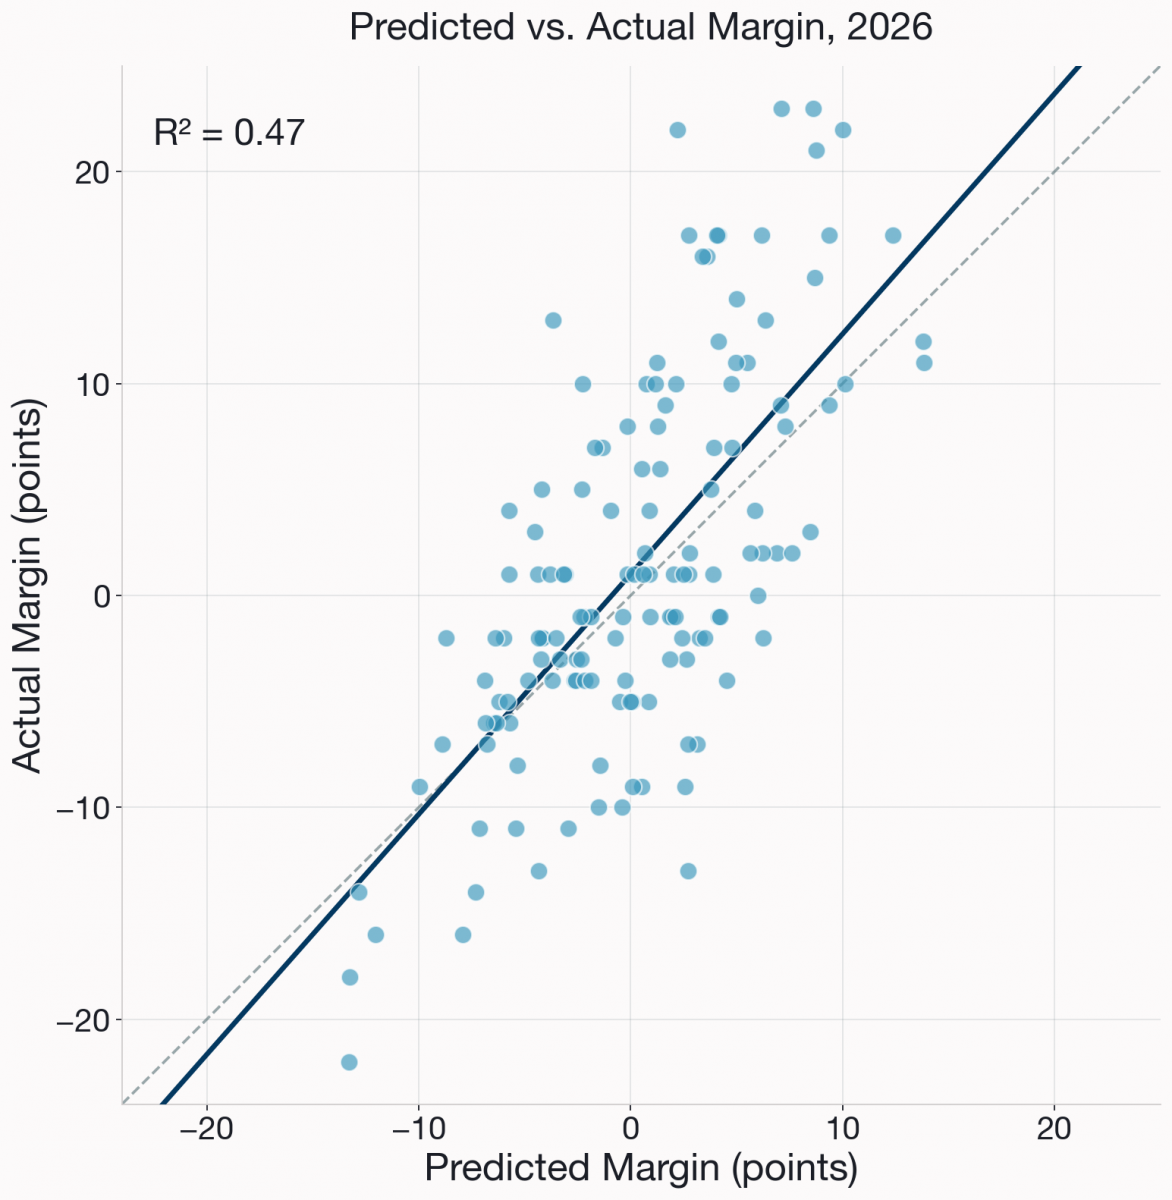
The model has picked the winner correctly in 73 percent of this season’s games, and just as importantly, its projected margins do a good job tracking the actual final scores. That accuracy and calibration are very comparable to the lines set in the major pro sports, and on some measures even outperform them, likely due to a larger skill gap between teams in the UFA than in a league like the NFL or NBA.
Some notable games:
-
Growlers at Bighorns, 7/4. Projected margin: Growlers by 10.11. Actual result: Growlers by 10.
-
Flyers at Hustle, 6/26. Projected margin: Flyers by 0.89. Actual result: Flyers by 1.
-
Wind Chill at Thunderbirds, 7/5. Projected margin: Wind Chill by 6.79. Actual result: Wind Chill by 7.
As is the nature of sports, it won’t be perfect, especially once the games that matter most arrive and the stakes change how teams play. But with the model’s track record established, here’s what it actually has to say about the two games that matter most this weekend.
Win Probabilities For The Semifinals
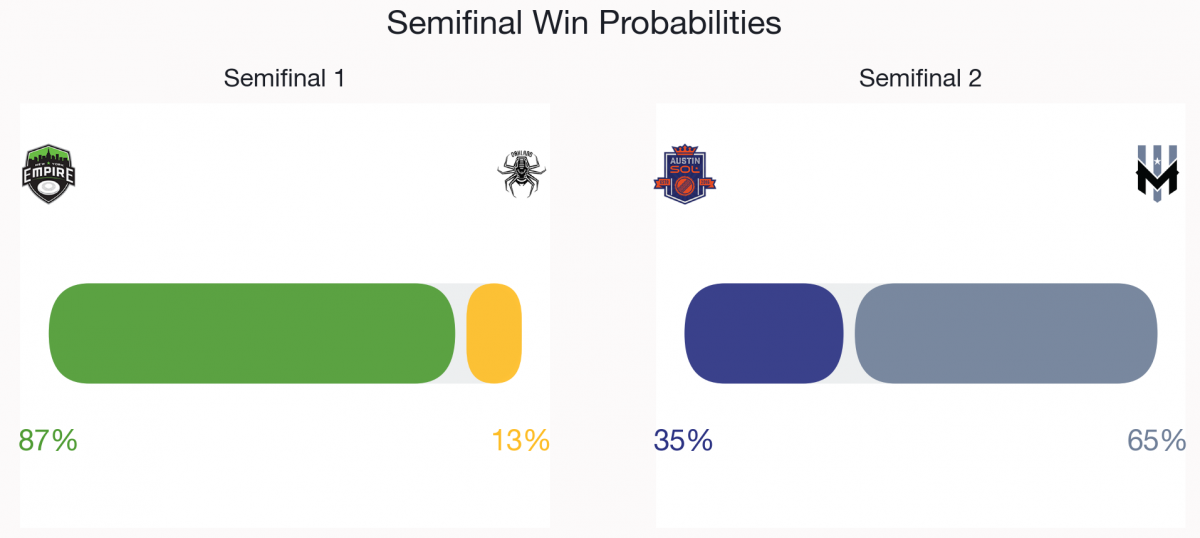
Coming off wins over Boston and DC, Empire leads the way as the favorite. Our model gives the Empire an 87.1 percent chance of moving on, projecting a final score somewhere around 23.7 to 19.0 and a final margin near four and a half points. Empire grades out as the best team in the entire league this season, first in the field on both sides of the disc, ahead of every other roster in 2026. With a record-setting 11.4 turnovers per game and a star-studded offense, this may not be a surprise. And yet they’ve still lost 2 games.
Oakland will certainly not go down without a fight. The Spiders have played through injuries for stretches of the season, and much of their roster overlaps with the Revolver squad that just won the club championship at Worlds, meaning the version of Oakland the model has been rating all year may not be the version that shows up at full strength. Oakland actually holds onto the disc slightly more often than Empire does across the full season, and if this team is healthier and sharper now than its regular-season numbers reflect, this could easily be a lot closer than the prediction suggests.
With Austin and Minnesota facing off in the other semifinal, we are projecting a tight game. Wind Chill comes in favored at 65.2 percent, but a projected margin under two points is about as close as a line gets. The edge, such as it is, comes almost entirely from offense, where Wind Chill grades out a shade ahead of Austin, 4th in the league versus 6th. Defense tells a different story than Minnesota’s reputation would suggest. Wind Chill’s D-line ranks just 6th in defensive efficiency and barely clears average once you adjust for the possessions it actually faced, while Austin’s D-line ranks 4th and clears that same bar more convincingly.
Run those same team strengths forward into every possible final, and we see the probable outcomes for the weekend.
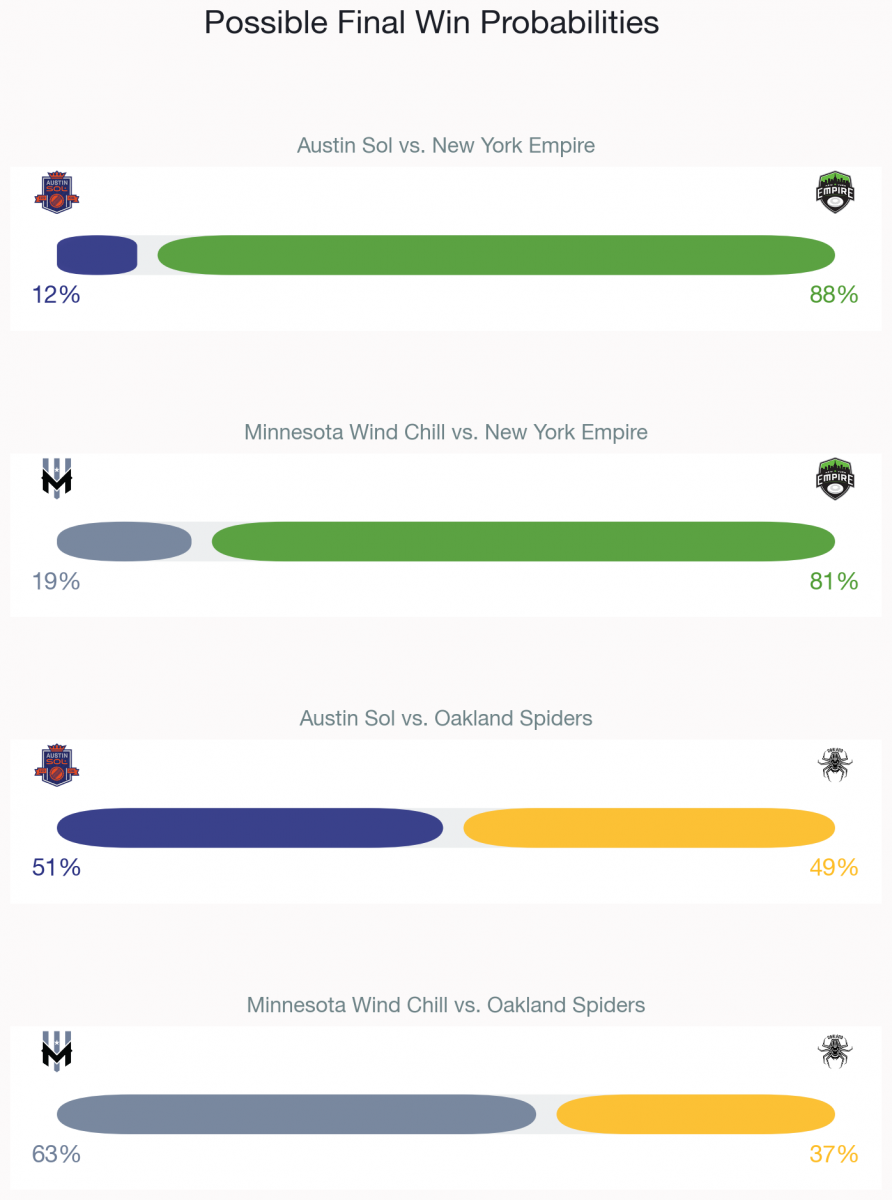
On paper, every matchup that includes Empire favors Empire, and every matchup that doesn’t include Empire is close to a coin flip. But given the questions around exactly how healthy and how sharp Oakland actually is right now, Thursday’s semifinal is the one game this weekend where the model’s number and the real uncertainty on the ground are furthest apart, and it may end up deciding the whole bracket either way.
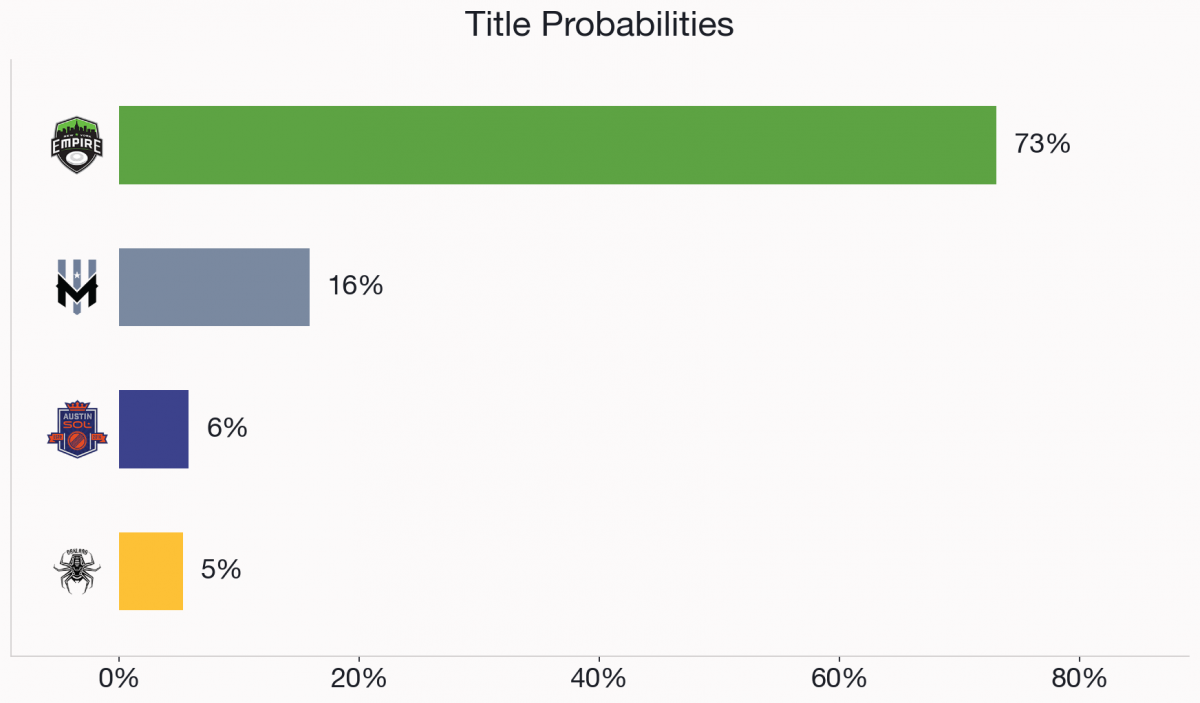
Put it all together across both semifinals and the four possible finals, and here’s each team’s actual odds of winning the whole thing.
What Is Deciding These Games?
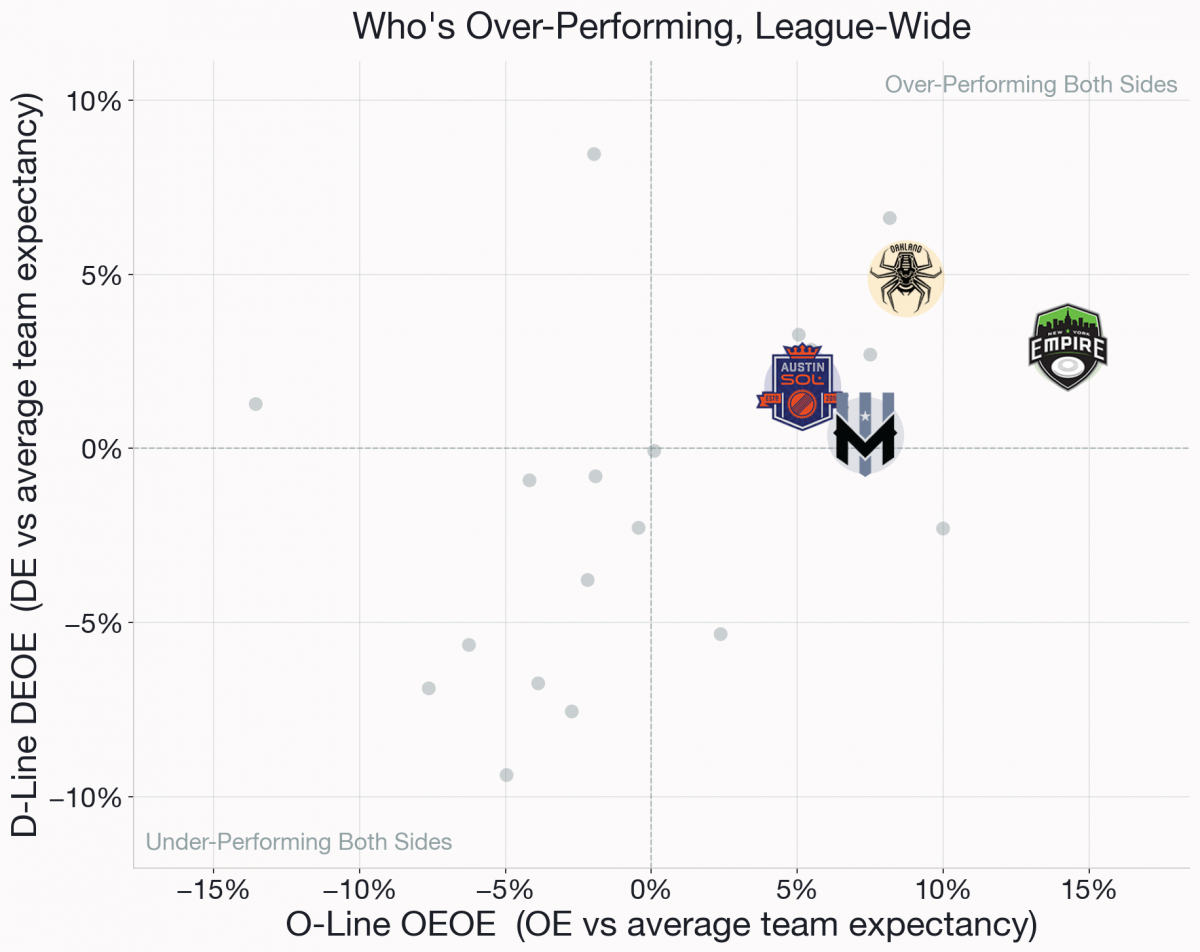
All four of these teams show up in the same corner of the league when you plot them against everyone else, outperforming what an average team would be expected to do given the exact same possessions. That’s what you’d expect from teams good enough to still be playing in late August. What’s more interesting is how differently they get there.
Start with New York, whose offense doesn’t just lead this bracket, it leads the entire league. The Empire’s O-line is scoring at a rate that beats its own degree of difficulty by more than any other unit in the sport this season, and it’s not the product of a risky, low-percentage deep game either, since their huck rate sits almost exactly at the league median and their completion percentage on those hucks is the best of anyone left standing. They are a team playing carefully and still finishing at the very top of the league, and that efficiency doesn’t fade once the field compresses either. New York’s red zone offense is the best mark among these four teams, full stop.
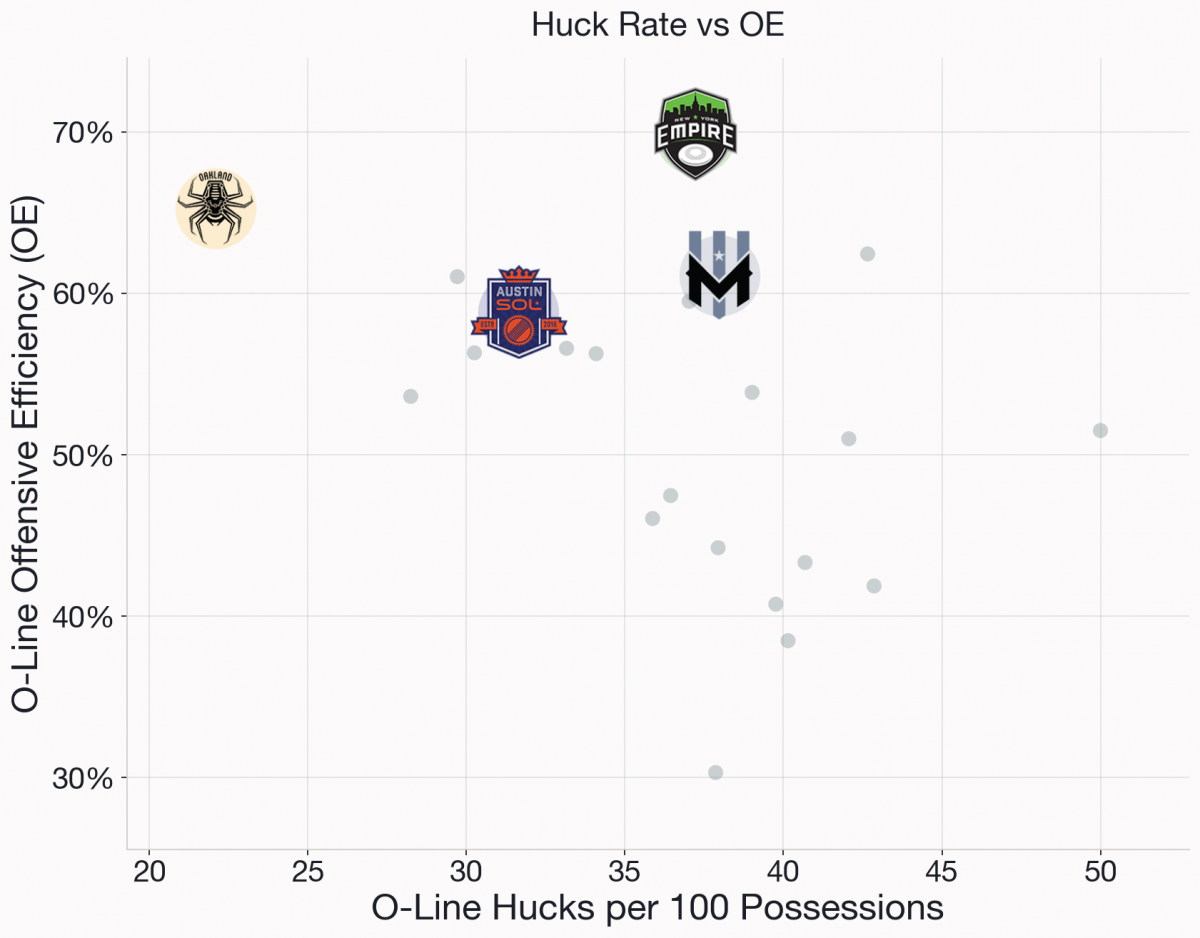
Oakland’s offense is a genuinely different animal. The Spiders huck less often than any O-line in the league and still post the second-best offensive efficiency in the sport, outperforming their own degree of difficulty by more than any other unit in this bracket. It’s an offense built almost entirely around not taking the risky shot, and it works. Where Oakland does have a real edge on New York is defense, a meaningfully better defensive efficiency number and a real advantage stopping teams once they get inside the red zone, and between that and the low-risk offense, it’s easy to see how they’ve arrived at their 12-1 record, despite dealing with key injuries at points throughout the season. We can’t fully account for whether Thursday gets a version of Oakland that’s healthier and sharper than the one it’s been rating all year.
The other semifinal doesn’t separate as cleanly on most numbers. Wind Chill’s offense grades out a little ahead of Austin’s, but it’s a real gap wrapped in enough shared strength on defense that neither team pulls away when you break it all the way down. The one place this matchup actually does separate is the red zone, and it favors Austin. Wind Chill’s defense has struggled to close out opponent trips inside the twenty all season, while Austin’s offense finishes at the best rate of the two teams once it gets there. If Austin can consistently work the disc that deep against a defense that’s had trouble all year, that’s the clearest lever either team has in what is otherwise a 50/50.
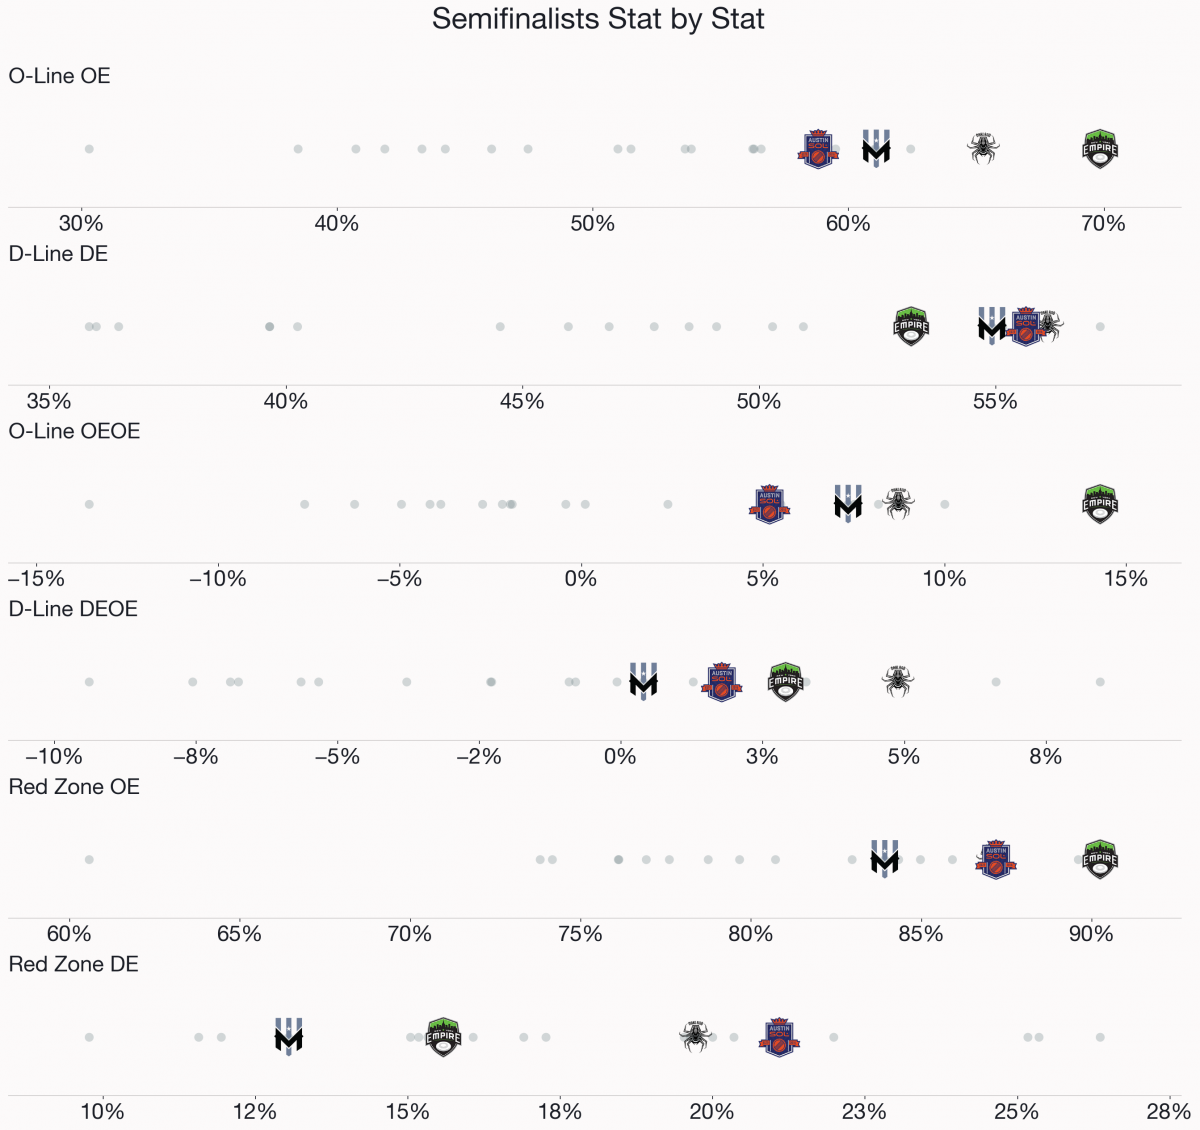
Empire is the clear favorite by the numbers, but Oakland’s health is a real question mark the season’s box scores can’t fully answer, and Austin and Minnesota is about as even as a semifinal gets. That’s the whole draw of a weekend like this. The model gives you the best data-driven read available, but it’s in no way a guarantee.
We’ll have a longer piece on the Shown Space Substack soon walking through exactly how this model works, the choices that went into building it, and what it took to get it performing at this level. For now, enjoy the games.
About Shown Space:
Shown Space is an analytics platform focused on bringing more depth and precision to ultimate frisbee. We combine data, modeling, and intuitive presentation to surface the patterns and choices that influence outcomes. If you want to learn more, you can visit shownspace.com, read more at the Shown Space Substack, or find the original Sloan paper, “A Machine Learning Approach to Throw Value Estimation in Professional Ultimate Frisbee”