July 7, 2026
By Braden Eberhard
Frisbee at the highest level is really two separate games. Each offense owns the disc and fights for perfection, while the D-line starts from scratch hunting for breaks. A single roster splits to optimize for completely different pressures, different personnel, different results. This piece is in two parts. Part 1 covers what's true across the league, the patterns that show up regardless of which team you follow. Part 2 profiles five specific teams where those patterns tell a real story. All stats cover the 2026 season through 109 games.
Part 1. The League-Wide Picture
Every Team Is Two Teams
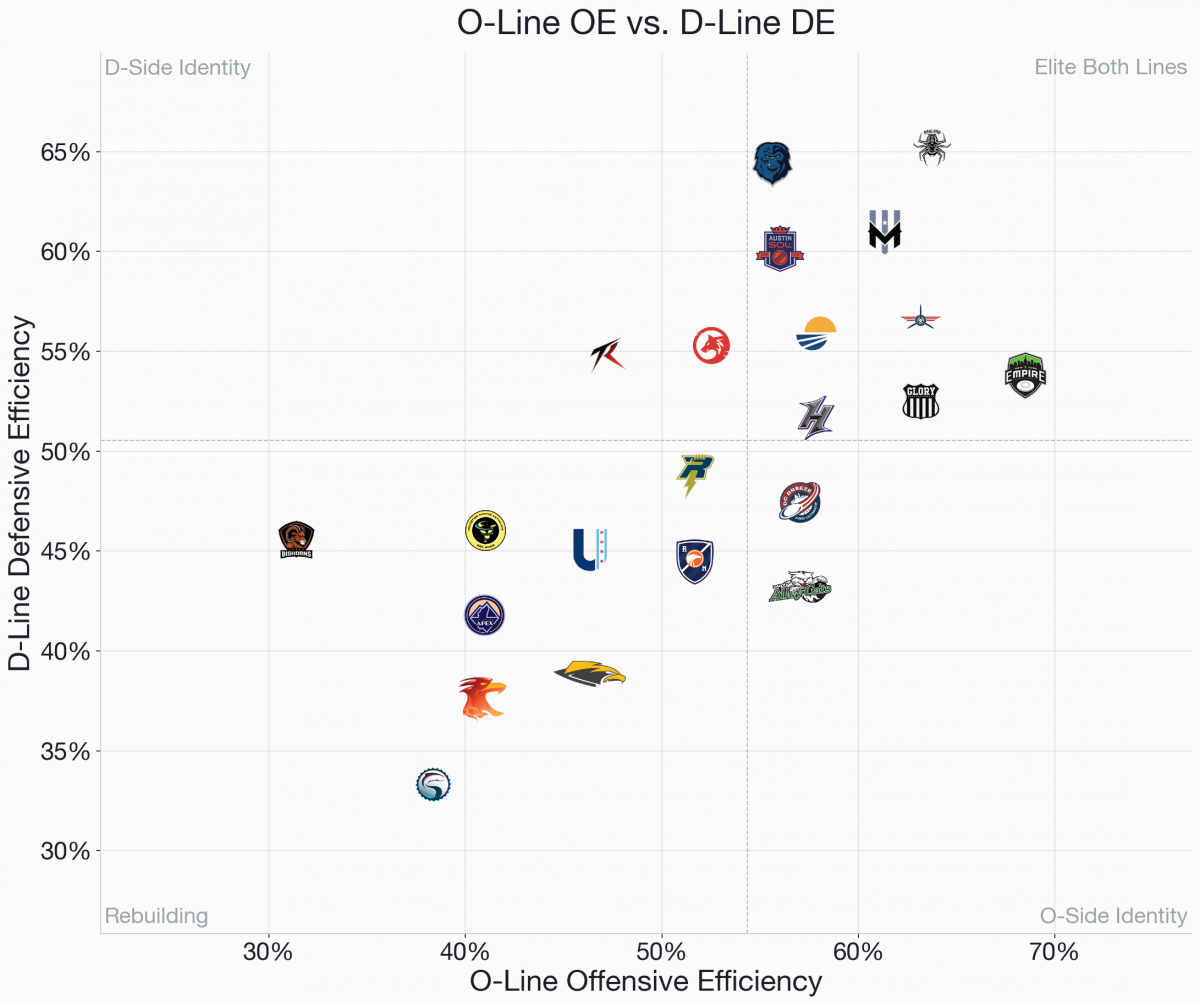 Plot every team's O-line offensive efficiency (OE) against its D-line defensive efficiency (DE) and the league sorts into four groups. Teams that are good on both sides, teams that lean on one unit to cover for the other, and teams still building either half. A handful of teams land in the "good at both" corner, while much of the league is trading off, strong on one side and just ordinary on the other, or struggling across the board. Possibly even more than the win-loss record, this identity separates the teams that look complete from the teams riding a single unit.
Efficiency vs. Expectation Tells Good From Lucky
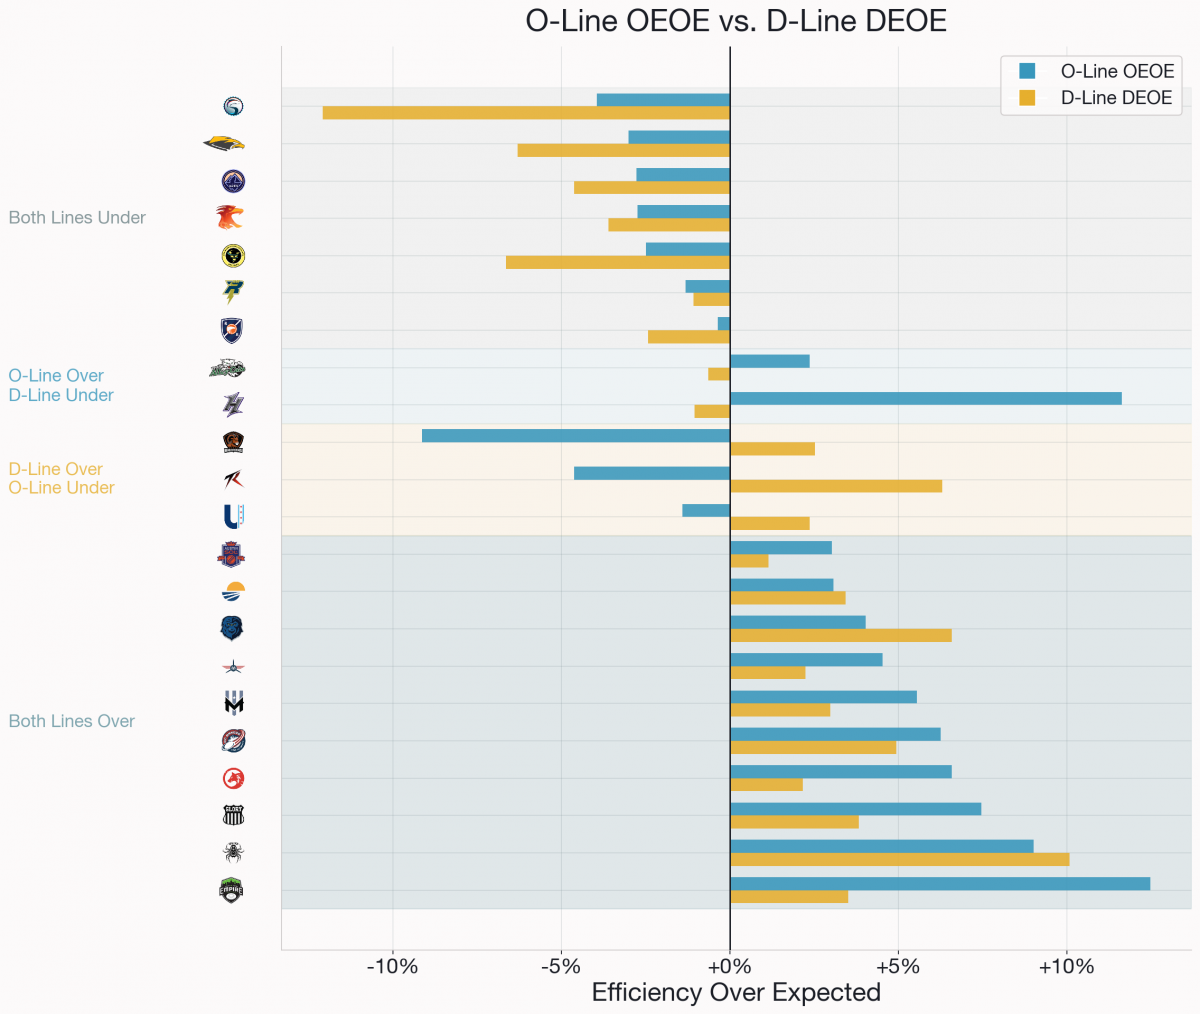
Raw efficiency numbers don't say whether a team is actually good or just facing an easier set of possessions than everyone else, more time on the clock, less distance to travel, better field position to work with. To separate the two, the model builds an expected offensive efficiency (xOE) and expected defensive efficiency (xDE) for every team, estimating how often a league-average team should have scored or stopped a possession given how difficult that possession actually was.
OEOE and DEOE are what's left once you compare that expectation to what actually happened, actual efficiency minus expected efficiency. A positive number means a unit converted, or stopped, more often than its profile predicted. A negative number means it left something on the table that an average team would have kept. Across the league, most teams' O-line and D-line move in the same direction, if the offense is over-performing, the defense usually is too, but there are several interesting cases where a team's two units pull in opposite directions. Part 2 covers some of the clearest examples of that split.
The Deep Ball Is A Tool, Not A Plan
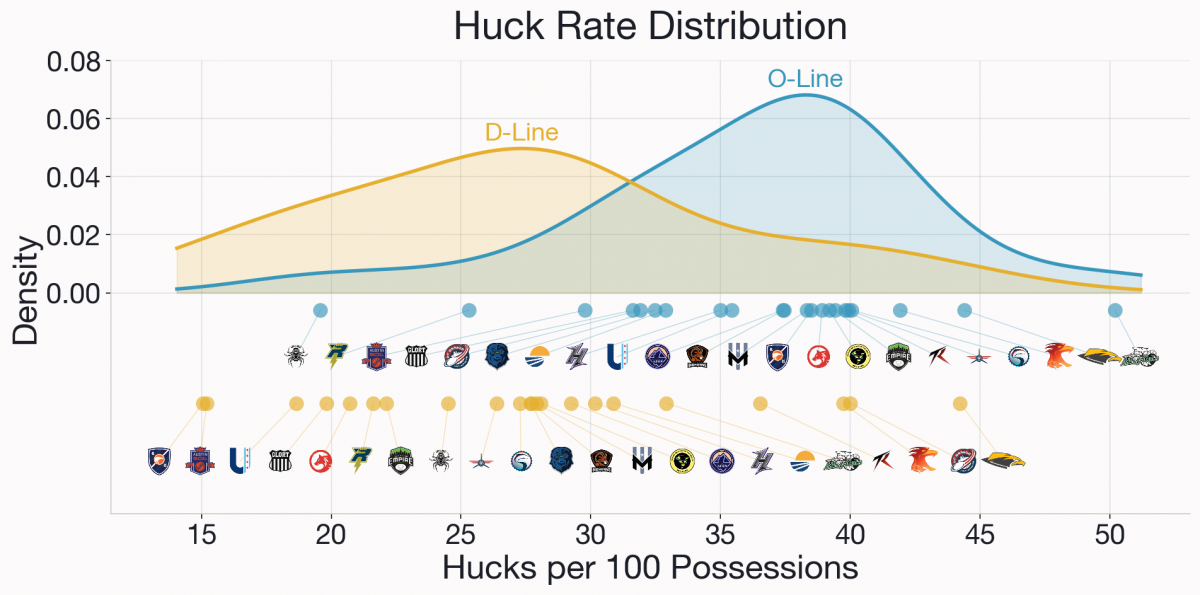
Huck rate, hucks attempted per 100 possessions, is the clearest style signal in the data, and it comes with a ceiling. Every team above roughly 40 hucks per 100 on the O-line sits in the bottom half of the league in O-line efficiency. Below that line, huck rate stops predicting anything useful. Some of the league's most efficient offenses barely huck at all, and some middling ones huck constantly. The pattern isn't that hucking is bad, since huck rate and efficiency are uncorrelated for the majority of the league. It's that at the very top of the volume distribution, it starts looking like a team's only plan rather than one option among several, and the efficiency numbers show it.
Finishing Is Its Own Skill
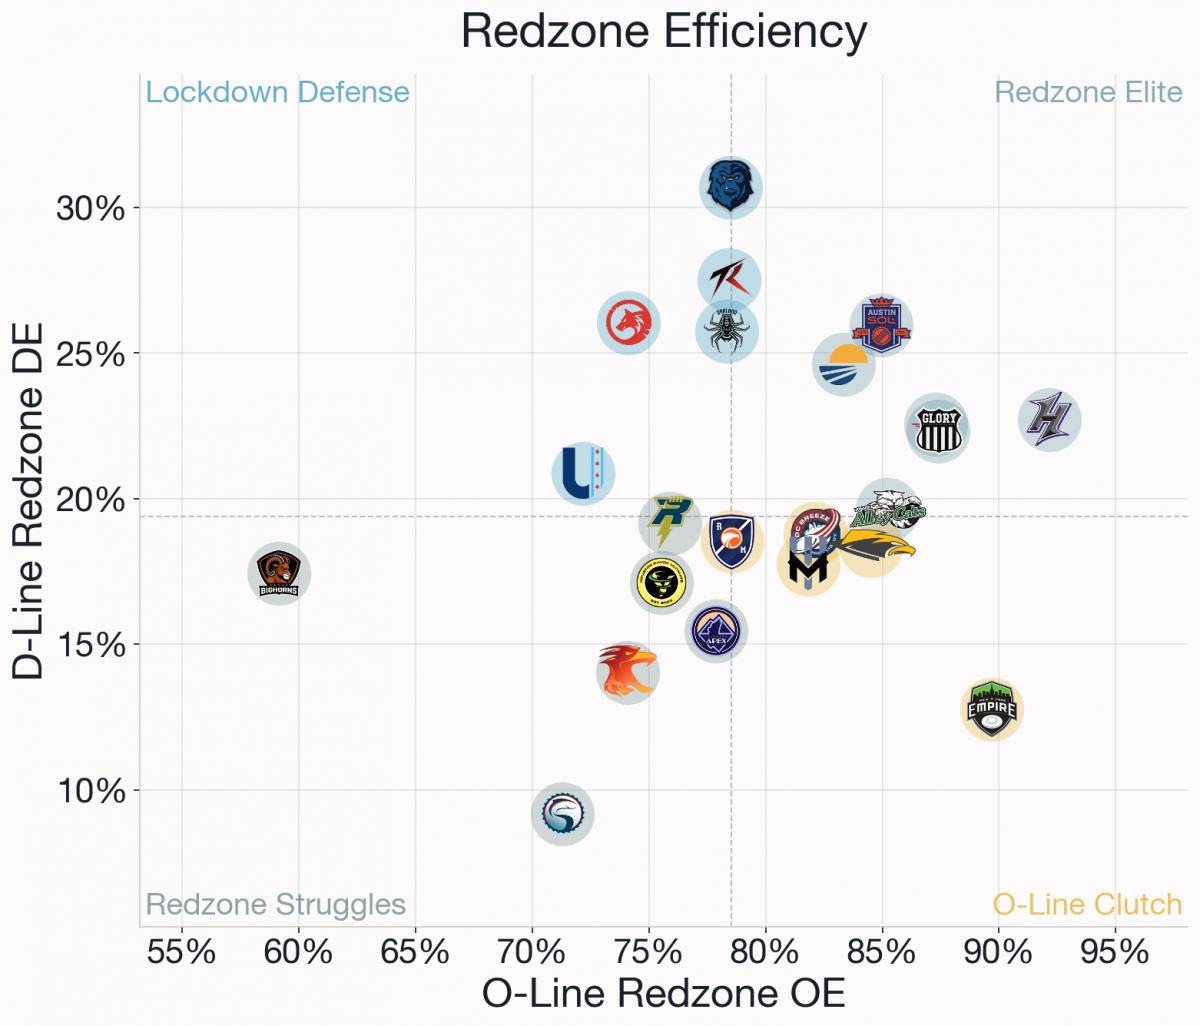
Reaching the red zone and finishing there are different skills. Red zone OE and DE measure conversion once a team is already inside the 20, where the field is compressed, the pressure is higher, and there's no room for error, and they don't track cleanly with a team's overall OE or DE. A team can be a middling offense in the open field and still be automatic once it reaches the red zone, or the reverse, efficient everywhere else and shaky the moment the field compresses.
Part 2. Team Profiles
New York Empire
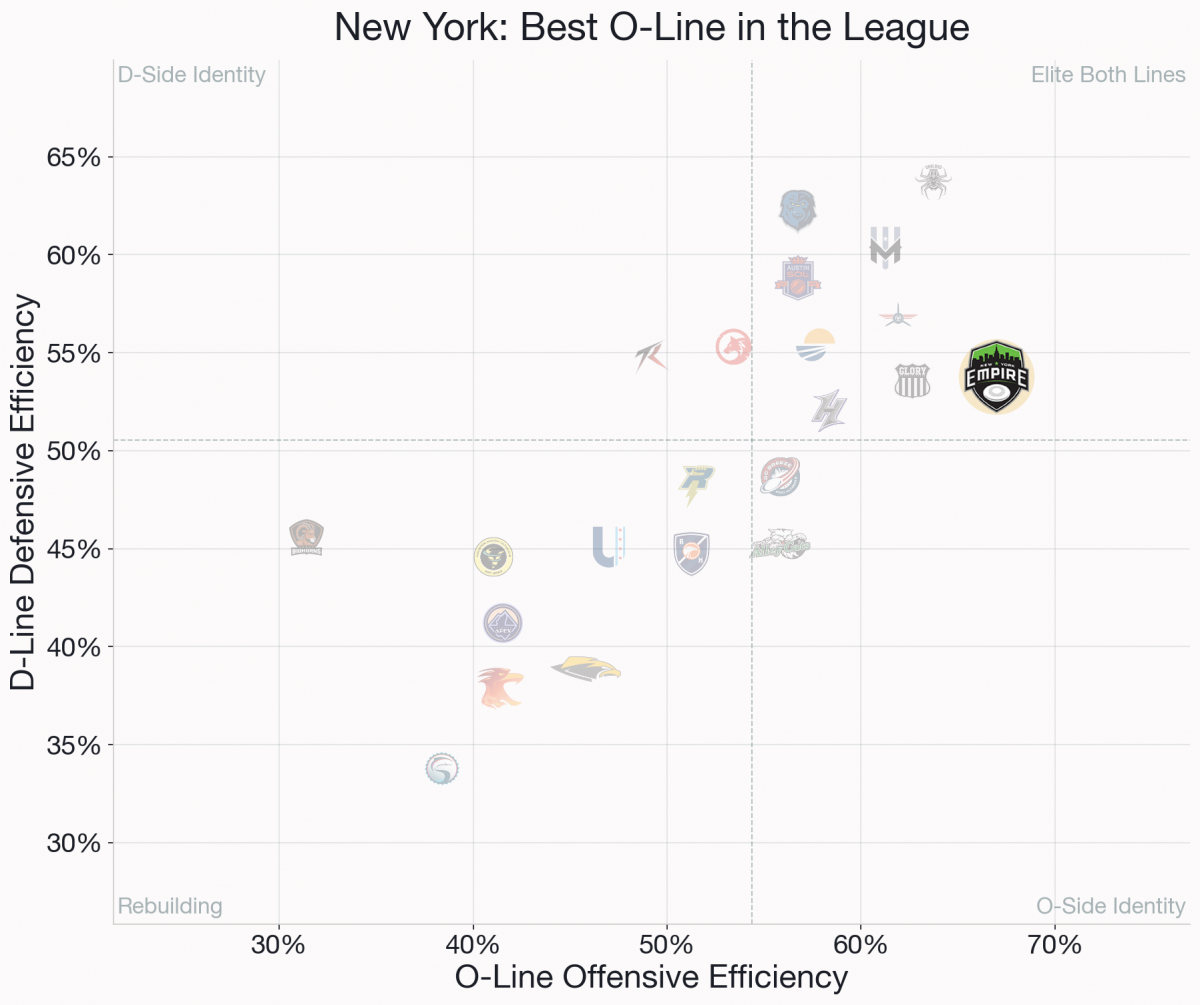
New York has the best O-line in the league, posting 67.0 percent offensive efficiency while turning the disc over just 6.2 times a game, the fewest for a team season in the modern stats era. It shows up on the scoreboard too, an 80.9 percent hold rate, the best mark in the league by three points. What separates New York from the rest of the top tier isn't a different style of attack. Their O-line hucks 39.4 times per 100 possessions, right in the middle of the pack among elite offenses, well above Oakland's 19.6 and below Carolina's 39.9. The difference is who's throwing. New York's O-line CPOE is +1.8 percent, second-best in the league behind only Seattle, meaning their throwers are completing passes at a higher rate than the difficulty of those throws would predict, on hucks and everything else. It's a roster full of good throwers, not a scheme built around avoiding risk.
The one gap is on the other side of the disc. New York's O-line finishes at an elite clip in the red zone (89.7 percent, second-best), but their red zone defense stops just 12.8 percent of opponent trips inside the 20, second-worst in the league, ahead of only Oregon. When opponents reach the Empire's red zone, they almost always finish. If New York has one real weak spot heading into the postseason, this is it.
Oakland Spiders
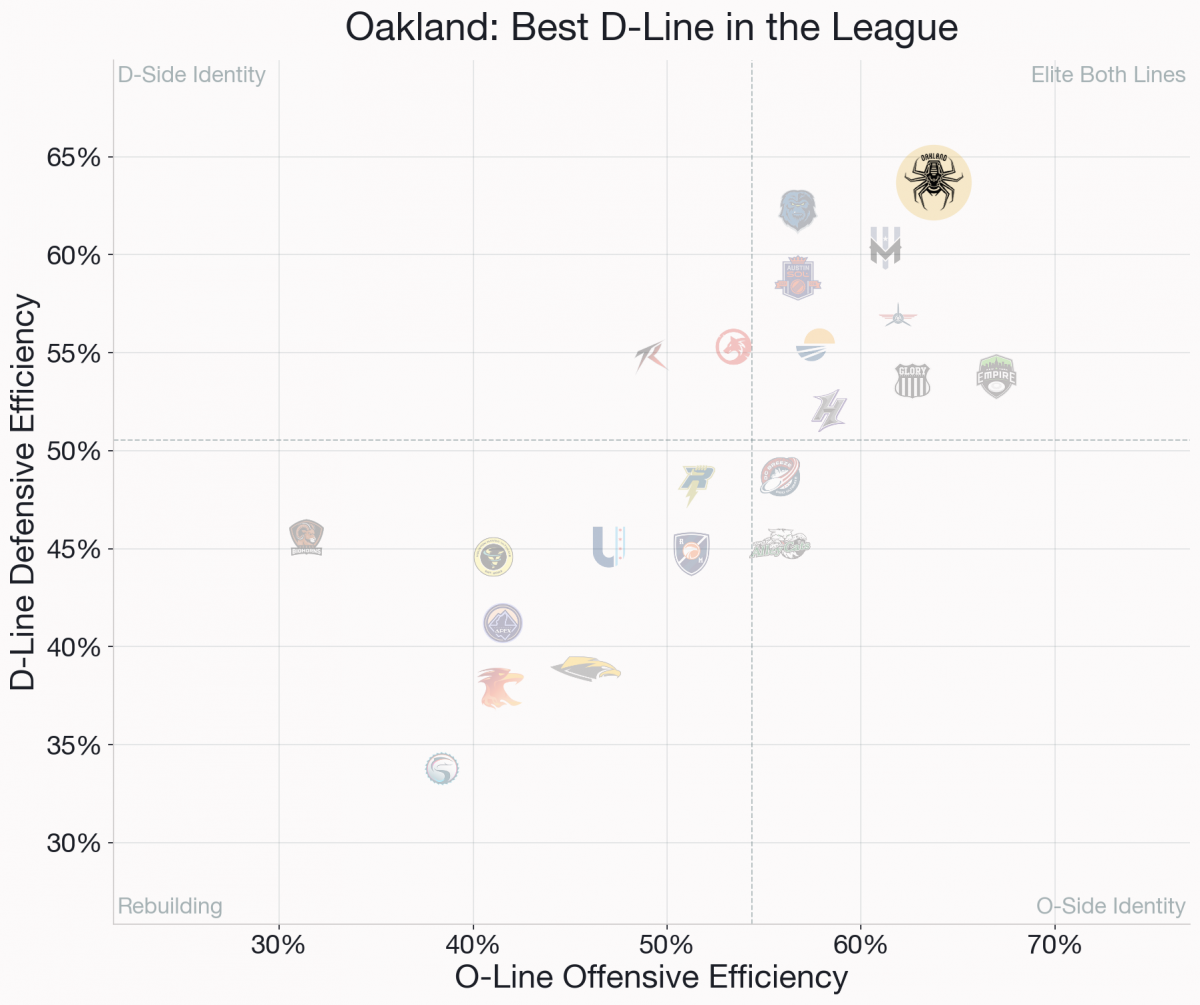
Oakland has the best D line in the league at 62.0 percent defensive efficiency, and it holds up once you adjust for how hard the possessions they actually defended were, and where on the field each possession started. Their D-line's DEOE is +10.1 percent, stopping possessions at a rate 10 points higher than a league-average defense would manage given those same conditions. Their break percentage (47.8 percent, also best in the league) shows the stops are turning into scored points, not just turnovers that go nowhere.
What stands out about Oakland specifically is that their D-line's DEOE (+10.1 percent) is actually higher than their O line's OEOE (+9.0 percent). Most teams with two strong units still lean O-side, New York's OEOE runs nearly nine points above its DEOE, and Atlanta's gap is even wider. Oakland is one of the few teams in the league where the defense is the unit outperforming its degree of difficulty by more than the offense is.
Oakland also shows that a heavy deep game isn't required to be efficient. Their O-line hucks just 19.6 times per 100 possessions, the lowest rate in the league, and still posts the second-best O-line efficiency, right behind New York. Oakland and New York are the only two teams in the league that check every box, good in aggregate, and still good once the model adjusts for schedule.
Atlanta Hustle
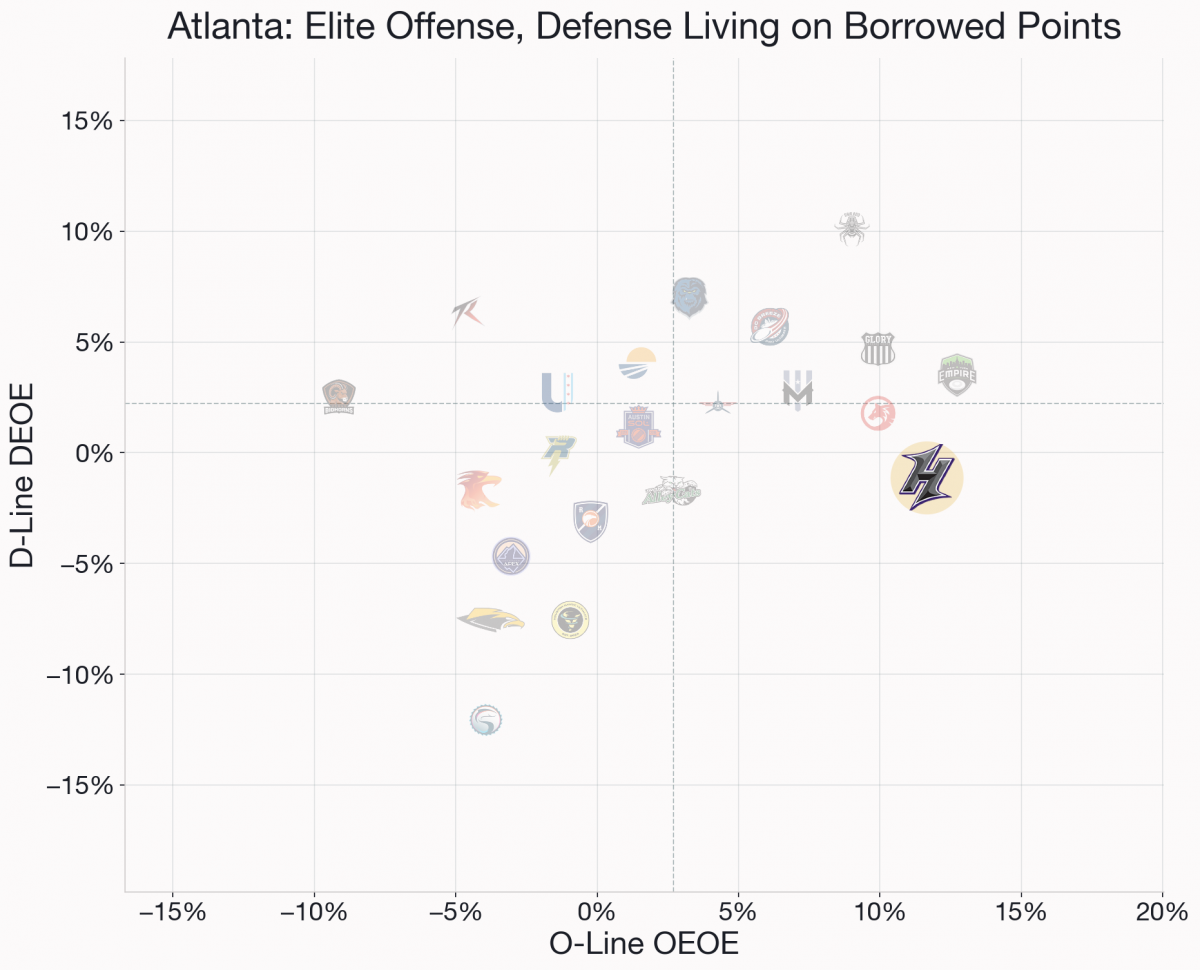
Atlanta is the most interesting team in this dataset, because its two lines are pulling in opposite directions once you strip out how difficult their possessions actually were. The chart above shows exactly where that split shows up.
Atlanta's O-line OEOE is elite at +11.6 percent, second-best behind only New York. But their D-line DEOE is -1.05 percent, meaning their defense is performing slightly worse than a league-average unit would once you account for the possessions they actually had to defend. Their 92.2 percent red zone offense is still the single best finishing number in the league, but red zone defense (22.7 percent) is middling. The offense doesn't need to prove anything else this season. At 5-5 and fourth in the South, the defense, both its overall efficiency and its red zone finishing, is what's kept Atlanta from turning an elite offense into a stronger record.
Salt Lake Shred
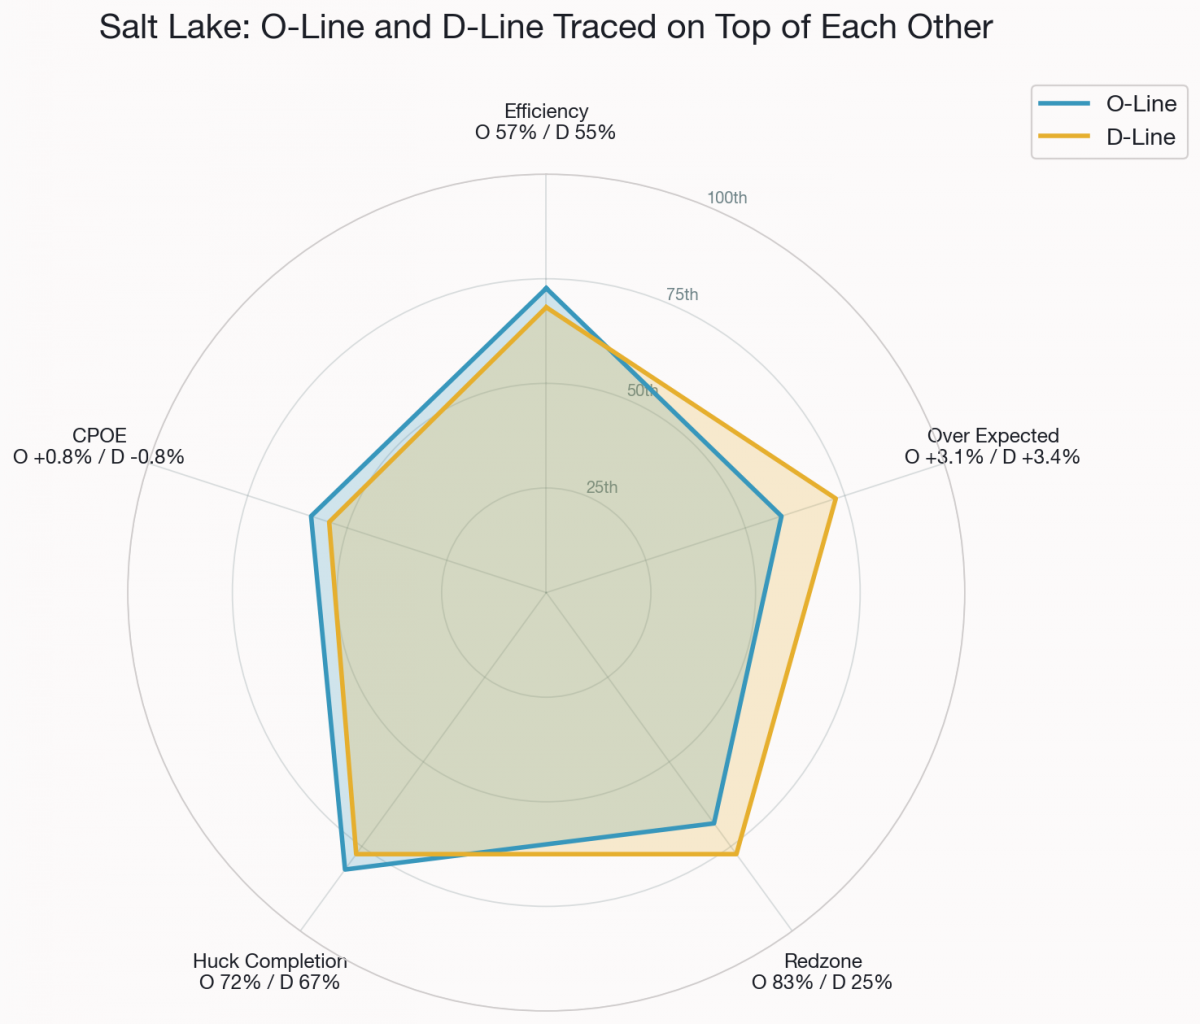
Each spoke is one stat. The blue shape is where Salt Lake's O-line ranks against every other O-line in the league on that stat, the gold shape is where their D-line ranks against every other D-line. Farther from the center means a higher percentile, so a value near the outer ring means that unit is near the top of the league on that measure. The raw numbers next to each label are Salt Lake's actual O-line and D-line values. The two shapes tracing almost the same outline shows how the O-line and D-line rank in nearly the same place, even though O-line and D-line stats aren't usually measuring the same thing.
Salt Lake doesn't have the raw efficiency numbers of the very top teams, but it stands out for a different reason. Rank each line against the league, O-line against O-lines, D-line against D-lines, across five different measures, and Salt Lake's two shapes trace almost on top of each other. Most rosters produce two genuinely different teams once the disc changes hands.
Their efficiency numbers move together, 57.2 percent O-line offensive efficiency and 55.1 percent D-line defensive efficiency. Their over-expected numbers are even tighter, O line OEOE at +3.1 percent and D line DEOE at +3.4 percent, meaning both units are beating their possession difficulty by almost the identical amount. Huck completion tracks closely too, 72 percent on the O line and 67 percent on the D line. The one place the two lines really diverge is the red zone. The O line converts 83 percent of red zone trips while the D line only stops 25 percent of opponent trips.
Indianapolis AlleyCats
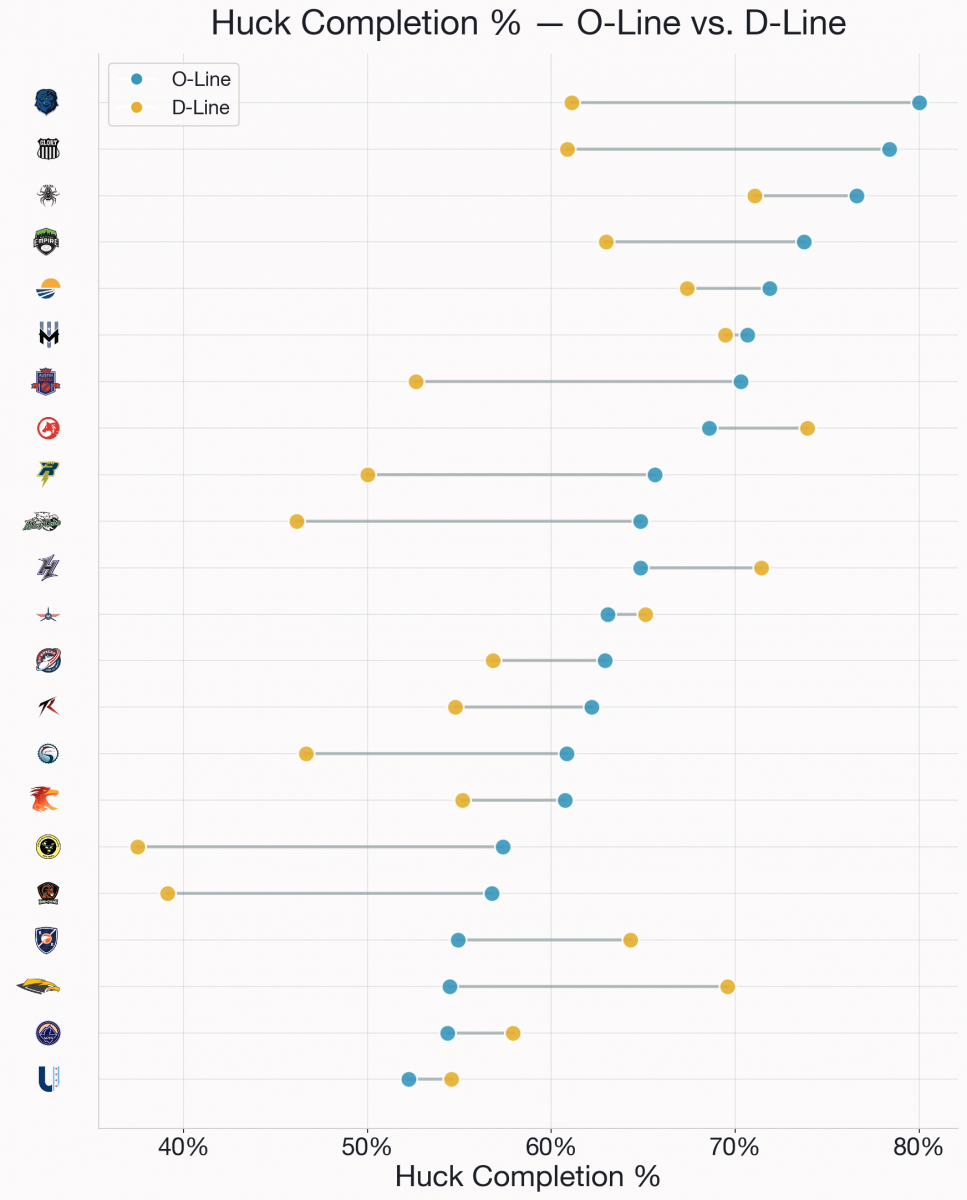
Indianapolis is a clear cautionary tale on the deep ball. The AlleyCats attempt 50.2 hucks per 100 possessions, the highest rate in the league by nearly six clear of the next closest team. It hasn't translated into offensive success. Indianapolis's O line OE is 53.7 percent, middle of the pack, and their OEOE is a modest +2.4 percent, nowhere near the league's top tier.
The completion split makes the diagnosis more specific. Indianapolis's O-line completes 64.8 percent of hucks, while their D-line completes just 46.2 percent, the widest O-to-D gap in the league. The O-line has clearly drilled the deep shot as a core read. The D-line, thrown into the same look off a turnover with far less setup, can't finish it nearly as often. It's evidence that Indianapolis's huck volume is a designed O-line strategy, not a team-wide identity, and that the D-line hasn't been built to run it.
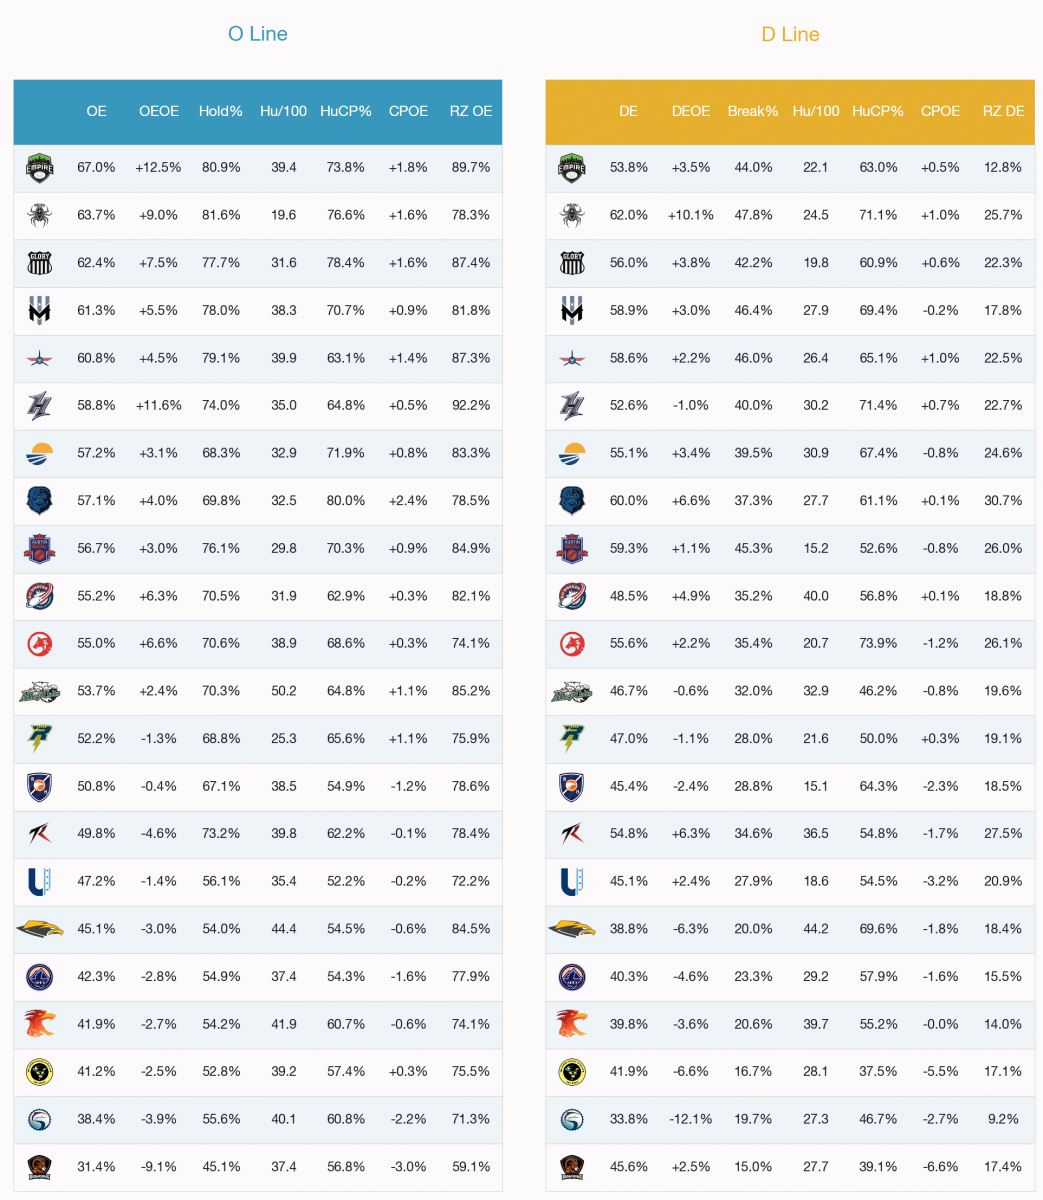
Full Data Reference
 The Full Picture
The most useful thing this data does is force you to stop thinking about teams as single units. Every roster in the league produces two meaningfully different teams once the disc changes hands, and the gap between those two teams can tell you more about a franchise's ceiling than the aggregate standings do.
New York built its identity around a disciplined, high-completion O-line and hasn't needed its D-line to look the same way to be effective. Oakland is the opposite build, a team that leans on defense first and gets there without hucking much at all. Atlanta is a study in contrast between its two lines, an offense that plays one way and a defense that's still finding its own version of that identity. Salt Lake is the rare team where the O-line and D-line read as the same team, and Indianapolis shows what happens when an identity, in this case an aggressive deep game, gets built into one line but not the other. These are just a few of the different answers to the same question, whether a team wants its two lines to feel like the same team or two teams sharing a roster, and that stylistic choice is worth watching as the postseason field takes shape.
About Shown Space:
Shown Space is an analytics platform focused on bringing more depth and precision to ultimate frisbee. We combine data, modeling, and intuitive presentation to surface the patterns and choices that influence outcomes. If you want to learn more, you can visit shownspace.com, read more at the Shown Space Substack, or find the original Sloan paper, “A Machine Learning Approach to Throw Value Estimation in Professional Ultimate Frisbee”