


June 9, 2026
By Braden Eberhard
The UFA looks very different than it did a few years ago. Teams are throwing fewer hucks, possessions are lasting longer, and turnovers feel more expensive because D-lines are better at turning them into breaks. Rather than asking only whether small ball is taking over, we use team- and line-level data from 2021 through 2026 to look at what has changed, where D-lines have improved, and what those trends suggest about the current state of ultimate frisbee.
Where The Data Comes From
The modern UFA stats era began in 2021, when teams started tracking games with consistent play-by-play detail after the COVID interruption. Each team has a stats person on the sideline using an iPad app to record every possession: who caught the disc, who threw it, where throws started and ended, when pulls and turnovers occurred, and how each point finished. Here is a figure from a paper we are working on that describes the data we have:
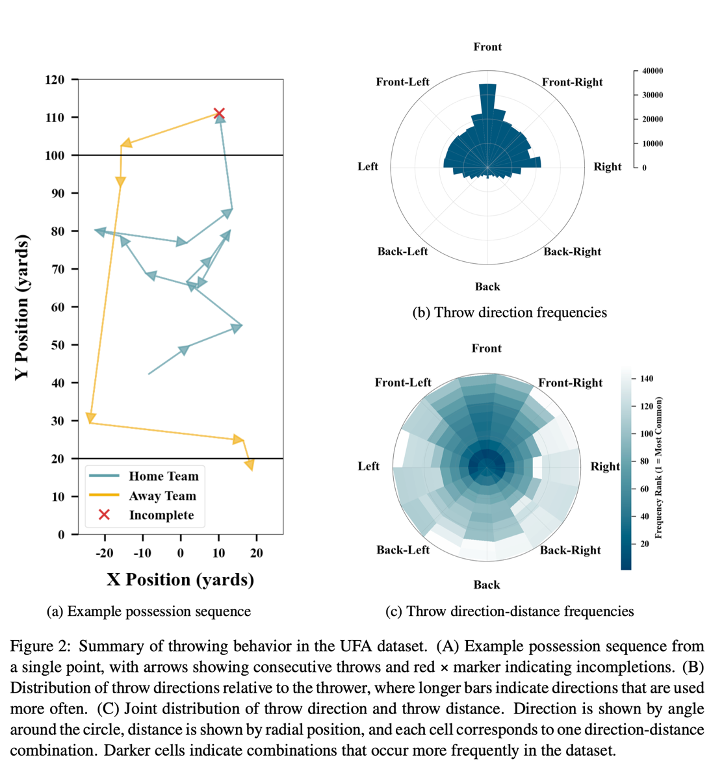
In mainstream professional sports, possession-level data has helped drive major analytics shifts, from baseball’s Moneyball era to basketball’s three-point revolution. Frisbee is earlier in that process, but the same kind of data is beginning to make broader analysis possible.
At Shown Space, we use play-by-play data to build team-, line-, and season-level metrics. Those tools are especially useful in a sport where strategy changes quickly, from older small-ball systems to modern team defense, force-middle structures, and deep-heavy offenses. This article uses those metrics to look past individual team styles and identify league-wide trends.
The League Is Deeper, Especially On Defense
The clearest change since 2021 is that defenses are better on both sides of the disc. They get the ball more often and convert breaks more frequently. In past seasons, an O-line turnover was damaging but not always decisive. Some D-lines could punish it, but many still needed a short field, a quick huck, or an individual play to turn the mistake into a break. In 2026, more D-lines can run something closer to a full offensive possession after the turn.
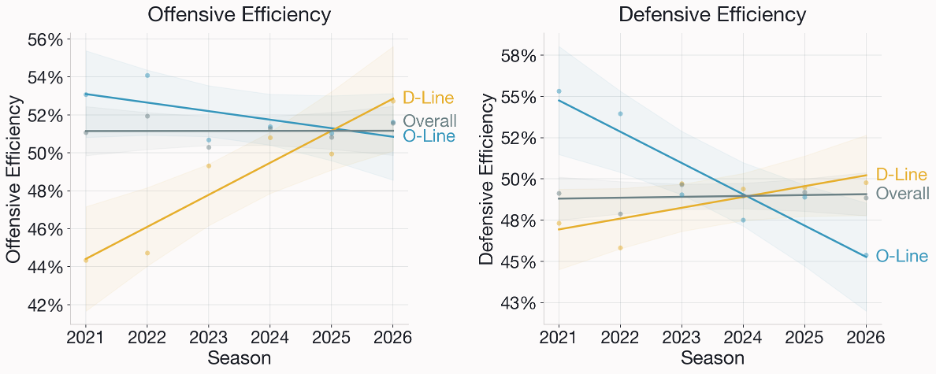
A striking observation here is that for the first time in the sample, D-lines now have better offensive efficiency than O-lines. On the defensive efficiency side, that crossover happened earlier, in 2024. This is worth looking into more closely, but one likely explanation is that O-lines usually begin by receiving the pull and needing to go the full length of the field, while D-lines start each point fresh and often get their first offensive chance after a turnover, frequently with better field position. That does not fully explain the trend, but it helps frame why D-line improvement may show up so strongly in the efficiency numbers.
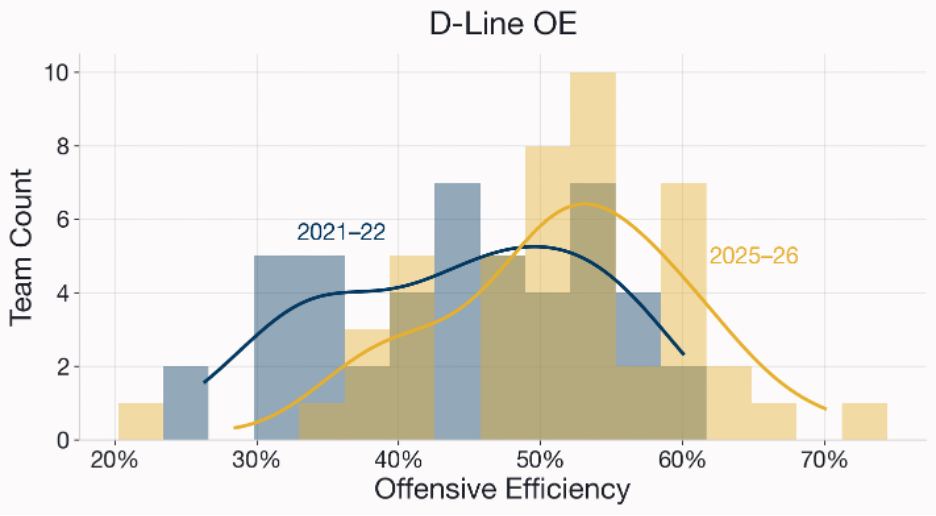
This shift is obvious when directly comparing D-line offensive efficiency across teams from early vs current years. The change is visible from top to bottom, suggesting that the sport is becoming more possession-based across the league, not only among the best or worst teams.
Fewer Hucks, Longer Possessions, Harder Holds
If the efficiency trends show that D-lines have become more productive, the next question is how possessions themselves have changed. Huck attempt rates have declined on both O-lines and D-lines, while throws per possession have increased. Teams are ending fewer possessions with early deep shots and completing more throws before a point is decided.
The D-line version of this trend is especially sharp. Their huck attempt rate has fallen more than O-lines’, and their throws per possession have increased more. That adds detail to the efficiency gains above. D-lines are not only scoring more after turnovers. They are also reaching those goals through longer possessions, resetting the disc, changing the point of attack, and creating later in the possession instead of relying only on the first counterattack.
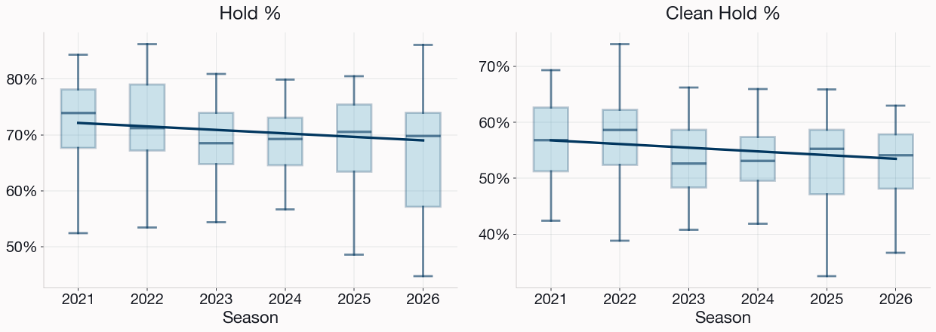
Clean hold percentage shows the same shift from the other side. It has fallen from roughly 57% in 2021 to roughly 51% in 2026. One read of this could be that O-lines have declined. But in the context of improved D-line performance and changing possession shapes, the more specific explanation is that D-lines are better. Overall hold percentage depends not only on whether an O-line can score, but also on what the opposing D-line can do with a mistake. As D-lines become more capable after the turn, O-lines have less room to give away a possession and still survive the point.
That changes the pressure inside a possession. O-lines still need to attack, and the data does not suggest they should remove risk entirely. But the cost of a turnover has changed. A throw that was acceptable when the opponent struggled to convert may carry a different cost against a D-line that can reset, move the disc, and finish the point. That could increase the value of continuation throws, bailout options, red-zone patience, and avoiding low-percentage turnovers in the first place.
There may also be a defensive implication for O-lines. If opposing D-lines are more likely to convert, then the seven O-line players on the field carry more responsibility after a mistake. Offensive players who can pressure immediately after a turn, hold up on the mark, or help generate a stop may become more valuable. The simpler answer may also be that teams need to protect the disc more carefully.
These questions become more important as the sport becomes more measurable. The current data can show how possessions are changing, how often teams huck, how efficiently each line converts, and how cleanly O-lines hold. It still leaves out important context, including weather, field dimensions, travel, division, opponent quality, and the specific defensive looks teams are using.
What Comes Next
The league-wide trends are worth taking seriously and will likely continue. As huck rates fall, possessions lengthen, clean holds grow scarcer, and D-lines convert more often than they did earlier in the sample, the question of what is driving those changes grows more pressing, and the answers are not all visible in the possession data. New pulling rules likely had a big effect on clean holds. Championship teams can influence what others try to copy, and Truck Stop's title may have shaped how teams thought about possession offense, defensive pressure, or post-turn structure. Changes to the disc may also have affected throw selection and completion rates. Weather, field dimensions, division, travel, and opponent quality can all push the same numbers in different directions.
The graphs in this article are meant to open up those questions rather than close them. They show a game that has become more possession-oriented, with D-lines playing a major role in that change. At Shown Space, we are building tools to make those trends easier to study across teams, seasons, and lines. If you want to look more closely at the numbers and how they fit into these patterns, visit our website at shownspace.com.
About Shown Space:
Shown Space is an analytics platform focused on bringing more depth and precision to ultimate frisbee. We combine data, modeling, and intuitive presentation to surface the patterns and choices that influence outcomes. If you want to learn more, you can visit shownspace.com, read more at the Shown Space Substack, or find the original Sloan paper, “A Machine Learning Approach to Throw Value Estimation in Professional Ultimate Frisbee”
