


 April 25, 2019
By Ian Toner
Through the second week of 2019 AUDL competition, every single game had been decided by four or fewer goals. As Evan Lepler put it in the Week 2 Tuesday Toss, the league was “11-for-11 in producing close, compelling action into the fourth quarter.”
Though Week 3 competition brought 2019’s first five- and nine-goal victories, on the whole, 2019’s results to date sparked other questions: What do these score lines look like when placed in context? That is, have we seen more close finishes this season compared to past seasons?
After examining margins of victory and related metrics from weeks 1 to 3 between 2012 and 2019, a picture of elevated parity in 2019 starts to emerge. The average margin of victory through three weeks in 2019 (exactly three goals) amounts to a smaller average margin than any other season through the first three weeks of play.
Year over year comparisons may not be perfect, considering the varying number of teams in the league and games completed by Week 3’s conclusion between seasons (among other factors). But comparing the number of games decided by three goals or fewer as a percentage of all games played through Week 3, 2019’s 63 percent (the same figure as 2018) represents a notably higher percentage than 2012-2017 AUDL results.
| YEAR | # of teams | Games played thru Week 3 | Avg margin of victory | 1G games | 2G games | 3G games | Margins of 3G or fewer | 10G+ games | Largest margin of victory |
| 2012 | 8 | 11 | 4.55 | 1 | 3 | 1 | 45% | 1 | 12 |
| 2013 | 12 | 18 | 6.94 | 5 | 1 | 0 | 33% | 6 | 17 |
| 2014 | 17 | 25 | 9.52 | 2 | 1 | 3 | 24% | 8 | 25 |
| 2015 | 25 | 33 | 6.76 | 3 | 5 | 3 | 33% | 7 | 23 |
| 2016 | 26 | 32 | 5.47 | 7 | 4 | 2 | 41% | 6 | 14 |
| 2017 | 24 | 27 | 6.93 | 1 | 3 | 3 | 26% | 8 | 17 |
| 2018 | 23 | 19 | 3.79 | 7 | 2 | 3 | 63% | 2 | 13 |
| 2019 | 21 | 19 | 3.00 | 4 | 5 | 3 | 63% | 0 | 9 |
What’s more, no team has captured a double-digit victory in 2019. At this point in the 2018 season, two double-digit victories had already been recorded. And every season since the league’s opening pull in 2012—including 2012, when teams played just 11 games through Week 3—has included at least one double-digit victory by Week 3’s end.
So why are AUDL teams generating tighter margins so early in 2019?

“Divisions are simply more evenly distributed with strength,” hypothesized Mike DeNardis, coach and owner of the Raleigh Flyers since 2015. “The West losing SF and the South losing Nashville balanced those two divisions out pretty well.”
Evan Lepler, the voice of the AUDL since 2014, said, “It certainly doesn't hurt that arguably the league's two most balanced divisions—the West and the South—have been featured early in the season, but I do think that rosters around the league are gradually becoming more balanced.”
DeNardis added, “I think fewer teams and fewer games make everyone a bit more prepared from week to week.”
To that end, services like the newly launched AUDL.TV have centralized game footage and facilitated scouting and footage-based coaching more quickly and efficiently than ever before.
Indianapolis AlleyCat Cameron Brock, a veteran of 109 AUDL games and one of six athletes still competing since the league’s inaugural season, claimed, “the floor of the league has risen dramatically since 2012.”
“There's more talent in the league than ever,” proclaimed Lepler. “Part of it is the players who have used the valuable AUDL reps to develop through the past several years. But I also think that the growing international presence and game-changing U.S. youth scene has bolstered depth everywhere.”
“Overall, teams have become way more talented,” agreed Tim DeByl, who has worn many hats while owning and coaching the Madison Radicals since 2013 (and directing the league’s marketing efforts). “My current Radicals roster would easily beat our 2013 and 2014 rosters, but teams in the division have actually narrowed the gap in scoring. Teams play us tighter now than they did in that era.

Consider the apparent improvement in one of Madison’s and Indianapolis’ most infamous divisional opponents. The Detroit Mechanix went winless in 2018, 2015 and 2014 while finishing 2017 with a 1-13 record. In 2018 alone, the Mechanix lost to the AlleyCats by margins of 20, 12 and nine goals. On Saturday night, the Mechanix kept their Alleycats matchup significantly closer, losing by just four goals. (And the AlleyCats’ gameday roster sported several of the team’s usual weapons, including Brock, Travis Carpenter, Rick Gross, Keegan North and Keenan Plew.)
Though one game does not a trend make, Brock noted, “After playing Detroit last night, I can tell you that they are much improved over teams from the past few years.”
“Coaching depth has certainly increased,” asserted San Diego Growler Jonathan “Goose” Helton, another “Original Six” athlete who has competed in every AUDL division over the course of his career.
“Teams have adjusted to the field size and rules,” said DeByl. “Underdog teams have started to understand how to slow the pace of the game down.”
Coaching improvements and team adjustments have been as simple as stacking an end of quarter line with the right “Hail Mary” personnel or traveling to road games with deeper rosters on a regular basis. They can be more sophisticated, too, in the form of spending years cultivating a talent pool more committed to AUDL play than other competitive outlets.

Four-time AUDL champion Beau Kittredge has noticed these and other evolutions. “Time management is a new understanding for ultimate players,” he said, comparing the AUDL game experience to USA Ultimate competition that lacks timed quarters. “Now you see teams playing the clock. You see teams better at protecting a lead.”
“AUDL teams have become AUDL teams,” argued DeByl. “Three or four years ago, you used to be able to say, ‘Oh, that team is just [USA Ultimate club team X] playing in the AUDL.’ Today, I am not sure there is a single team that is really basically a club team in the AUDL. This is important for player energy and continuity, and just more buy in. Overall, it leads to better effort and better rosters.”

Perhaps the most tactical explanation for tighter games in 2019 stems from a subtle rule change introduced this year. Rule 5.2.3 permits the clock to start when a pull is released, unless “there are 60 seconds or less remaining in any quarter or overtime period at the time of the pull.” Though said change may not be noticeable to the casual viewer, its impact can compound over the course of a game.
(Previously, Rule 5.2.3 specified that the clock could not restart until “(1) the disc is touched by an offensive player on the entire playing field, or (2) the disc is brought to the appropriate spot on the field if the pull was out of bounds, or (3) the disc is brought to the appropriate spot on the field if an offside infraction occurred.”)
Brock surmised, “Estimating about five seconds per pull, roughly 45 pulls per game and factoring in out of bounds pulls, I estimate the live action in games is anywhere from 4-7 minutes shorter, depending on the number of out of bounds pulls. All of that is to say that a lesser team will not fall as far behind due to the clock starting earlier and running while discs float out of bounds. A shorter game benefits the less talented teams.”
The extra clock runoff during pulls has curtailed live action throughout games, producing competitions with fewer points played and fewer turnovers. Comparing the first three weeks of 2019 game data against results from the previous five full AUDL seasons, points played per game have decreased by roughly 10 percent. Possessions per game have dipped even further, decreasing by about 15 percent.
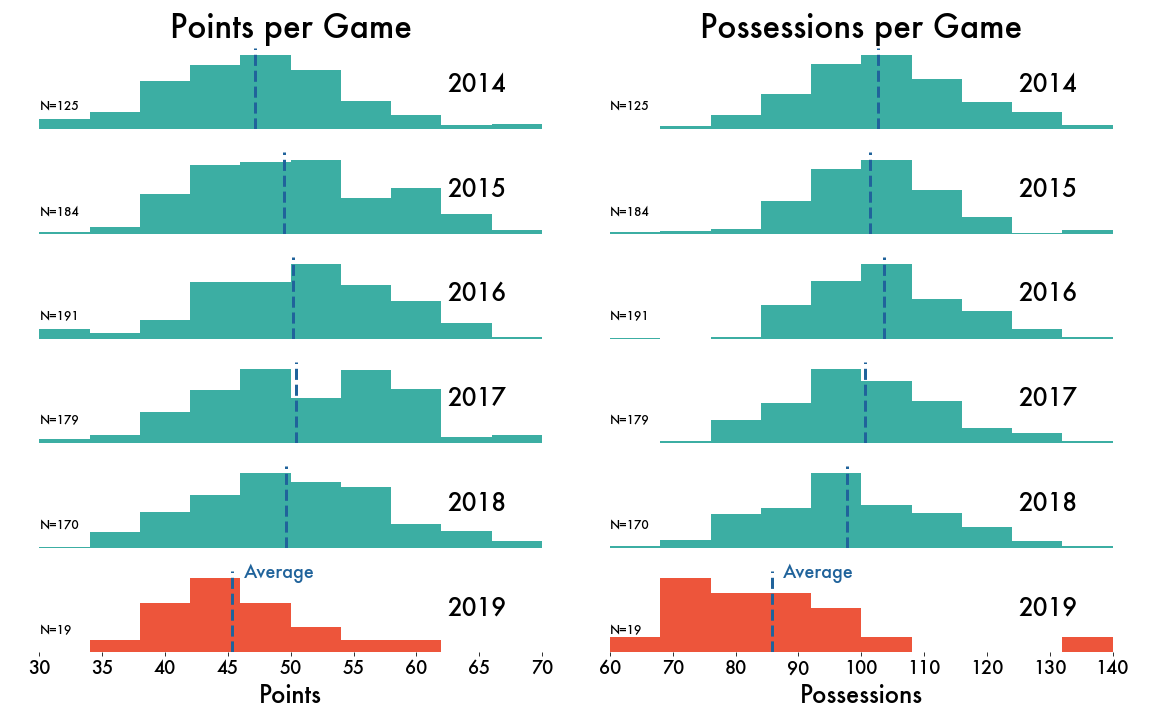
Graphic courtesy of Dan Fiorino (SOTG Stats)
Lepler pointed out that nearly 95 percent of 2019’s games have been decided by five goals or fewer. “And frankly,” he argued, “the only ‘blowout’ was 11-9 at half and 17-13 through three quarters before Madison erupted in the fourth to win by nine [over Pittsburgh in week 3]. Overall, it's really been a thrilling way to start the season all around the league.”
Dan Fiorino contributed to this report.
